
Figure 5, kinematics over the trial
MLAI - Visual uncertainty and task demands shape active sensing strategies in mice
Kinematics over the trial, by aperture.
Load the data
Imports, task selection (contrast_white_target, multi_occlusion), included sessions, and their interpolated trajectories.
import pandas as pd
import matplotlib.pyplot as plt
import seaborn as sns
import numpy as np
from vr4mice.analysis import plotting
from vr4mice.schema import base_analysis
from vr4mice.analysis.analysis import style
from vr4mice.schema.interpolated_trajectories import InterpolatedTrials
from vr4mice.schema.decision import InclusionStatus, ExperimentMember, LabelSet, Label, PredictionModel10Windows, DecisionPoints10Windows

from statsmodels.stats.anova import AnovaRM
import scipy.stats as stats
import matplotlib.colors as mcolors
import matplotlib.cm as cm
from vr4mice.analysis import regression

from scipy.stats import pearsonr
from mpl_toolkits.axes_grid1 import make_axes_locatable

from vr4mice.analysis.stats import get_multi_p_values_global, get_multi_p_values_binned, plot_aperture_heatmap

style()

save_fig_path = "notebooks/Paper_figures/Figure_output/"
task_type_key = {"set_name": "contrast_white_target",
"stage_name": "multi_occlusion",}sessions_list = list(
(InclusionStatus * ExperimentMember & {"included": 1} & task_type_key).fetch(
"dataset"
)
)
len(sessions_list)25# This takes a while to fetch because we need to fetch data for all trials
dataset_list = []
for d in sessions_list:
print(d)
try:
dataset_list.append(pd.DataFrame((InterpolatedTrials() & f'dataset = "{d}"').fetch(as_dict=True)[0]))
except Exception as err:
print(err, " dataset missing")
interpolated_df = pd.concat(dataset_list)
interpolated_df["mouse_name"] = interpolated_df.dataset.str.split("_").str[0]31726_2025-03-27_1
31726_2025-03-28_1
31728_2025-03-11_1
31728_2025-03-14_1
J729_2024-12-11_1
J729_2024-12-12_1
J729_2024-12-13_1
J729_2024-12-15_1
Jacana_2024-08-21_1
Jacana_2024-08-22_1
Kiwi_2024-08-19_1
Kiwi_2024-08-20_1
Kiwi_2024-08-21_1
Lemming_2024-08-14_1
Lemming_2024-08-15_1
Lemming_2024-08-19_1
Nightingale_2024-08-15_1
Nightingale_2024-08-16_1
Nightingale_2024-08-21_1
Nightingale_2024-08-22_1
Oribi_2024-08-26_1
Oribi_2024-08-27_1
Oribi_2024-08-29_1
Pheasant_2024-08-26_1
Pheasant_2024-08-28_1
Kinematics over the trial
Data from Load the data. Lines: mean across sessions. Bands: standard error. Colour: aperture.
Combined velocity
fig, ax = plt.subplots(1, 1, figsize=(5, 5))
ax = ax
mean_mouse = interpolated_df.groupby(
    ["dataset", "aperture", "trial_length"], as_index=False
).mean(numeric_only=True)

mean_mouse.sort_values("aperture", inplace=True)
mean_mouse["aperture"] = mean_mouse.aperture.astype("str")

sns.lineplot(
    data=mean_mouse,
    x="trial_length",
    y="velocity",
    palette=plotting.colors_multi_aperture,
    hue="aperture",
    errorbar="se",
    ax=ax,
)

sns.despine(offset=10)
ax.set_xlabel("Trial progression")
ax.set_ylabel("Combined velocity (cm/s)")
plt.savefig(save_fig_path + "figure5_velocity.svg", transparent=False)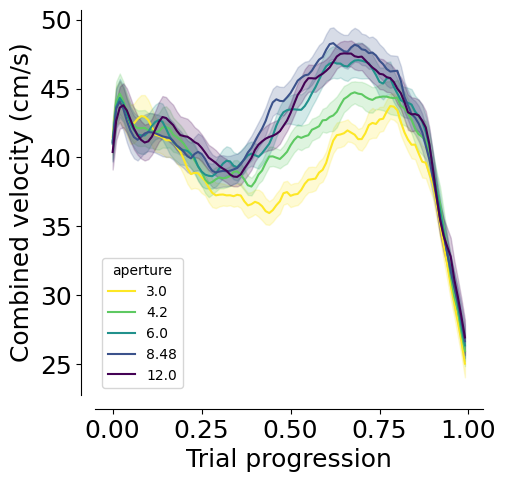
Velocity, tortuosity and distance to port
mean_mouse = interpolated_df.groupby(
    ["dataset", "aperture", "trial_length"], as_index=False
).mean(numeric_only=True)

fig, ax = plt.subplots(2, 2, figsize=(12, 8))
ax = ax.flatten()

for (i, label), label_str in zip(enumerate(
    ["velocity_x_fliped", "velocity_y", "local_tortuosity", "distance_to_choice"]
), ["x velocity (cm/s)", "y velocity (cm/s)", "Local Tortuosity", "Distance to Port (cm)"]):
    sns.lineplot(
        data=mean_mouse,
        x="trial_length",
        y=label,
        palette=(
            plotting.colors_aperture[:2]
            if len(mean_mouse.aperture.unique()) == 2
            else plotting.colors_multi_aperture
        ),
        hue="aperture",
        errorbar="se",
        ax=ax[i],
    )
    ax[i].set_ylabel(label_str)
    ax[i].set_xlabel("Trial progression")
    sns.despine(ax=ax[i], offset=10)

plt.tight_layout(pad=2)
plt.savefig(save_fig_path + "figure5_velocity_tortuosity_distance.svg", bbox_inches="tight", transparent=True)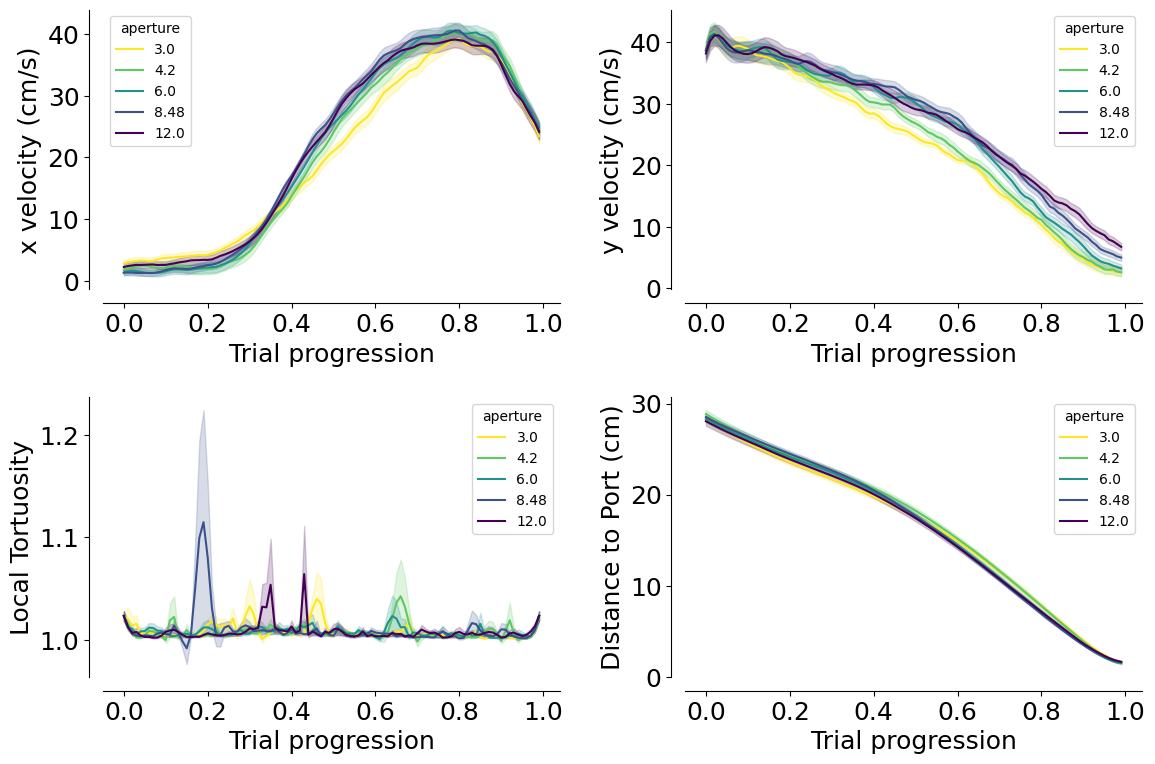
Running direction and head-body angle
Line style: choice (trial_left_choice).
mean_mouse = interpolated_df.groupby(
    ["dataset", "aperture", "trial_left_choice", "trial_length"], as_index=False
).mean(numeric_only=True)

fig, ax = plt.subplots(1, 2, figsize=(12, 4))
ax = ax.flatten()

dash_styles = {
    mean_mouse.trial_left_choice.unique()[0]: "",         # Solid
    mean_mouse.trial_left_choice.unique()[1]: (5, 5)      # Dashed
}

for (i, label), label_str in zip(enumerate(["heading_dir", "head_angle"]),
                                 ["Running direction", "Head-body angle"]):
    sns.lineplot(
        data=mean_mouse,
        x="trial_length",
        y=label,
        palette=plotting.colors_choice[::-1]
        if len(mean_mouse.aperture.unique()) == 2
        else plotting.colors_multi_aperture,
        hue="trial_left_choice"
        if len(mean_mouse.aperture.unique()) == 2
        else "aperture",
        style=(
            "aperture"
            if len(mean_mouse.aperture.unique()) == 2
            else "trial_left_choice"
        ),
        dashes=dash_styles,
        errorbar="se",
        ax=ax[i],
    )
    ax[i].set_ylabel(label_str)
    ax[i].set_xlabel("Trial progression")
    sns.despine(ax=ax[i], offset=10)


plt.tight_layout(pad=2)
plt.savefig(save_fig_path + "figure5_heading_dir_head_angle.svg", bbox_inches="tight", transparent=True)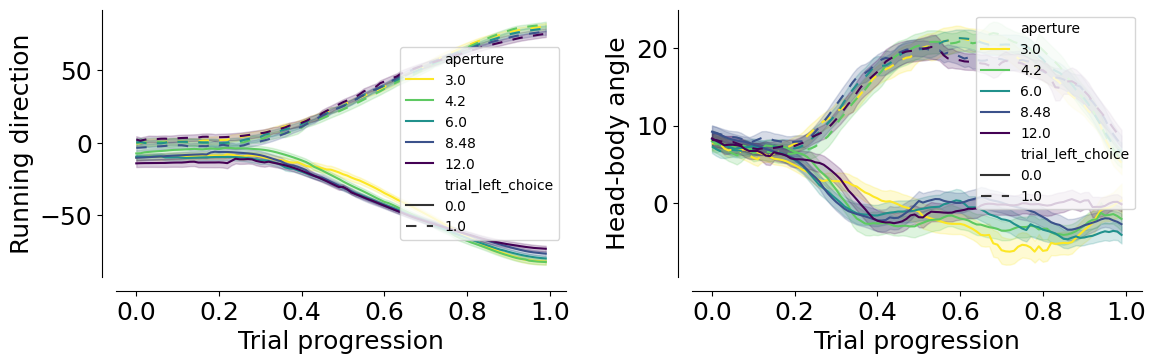
Running direction and head-body angle, as cosine and sine
mean_mouse = interpolated_df.groupby(
    ["dataset", "aperture", "trial_left_choice", "trial_length"], as_index=False
).mean(numeric_only=True)

fig, ax = plt.subplots(2, 2, figsize=(12, 8))
ax = ax.flatten()

dash_styles = {
    mean_mouse.trial_left_choice.unique()[0]: "",         # Solid
    mean_mouse.trial_left_choice.unique()[1]: (5, 5)      # Dashed
}

for (i, label), label_str in zip(enumerate(
    ["heading_dir_cos", "heading_dir_sin", "head_angle_cos", "head_angle_sin"]
), ["cos(Running Direction)", "sin(Running Direction)", "cos(Head-Body Angle)", "sin(Head-Body Angle)"]):
    sns.lineplot(
        data=mean_mouse,
        x="trial_length",
        y=label,
        palette=plotting.colors_choice[::-1]
        if len(mean_mouse.aperture.unique()) == 2
        else plotting.colors_multi_aperture,
        hue="trial_left_choice"
        if len(mean_mouse.aperture.unique()) == 2
        else "aperture",
        style=(
            "aperture"
            if len(mean_mouse.aperture.unique()) == 2
            else "trial_left_choice"
        ),
        errorbar="se",
        ax=ax[i],
        dashes=dash_styles,
    )
    ax[i].set_ylabel(label_str)
    ax[i].set_xlabel("Trial progression")
    sns.despine(ax=ax[i], offset=10)


plt.tight_layout(pad=2)
plt.savefig(save_fig_path + "figure5_heading_dir_head_angle_cos_sin.svg", bbox_inches="tight", transparent=True)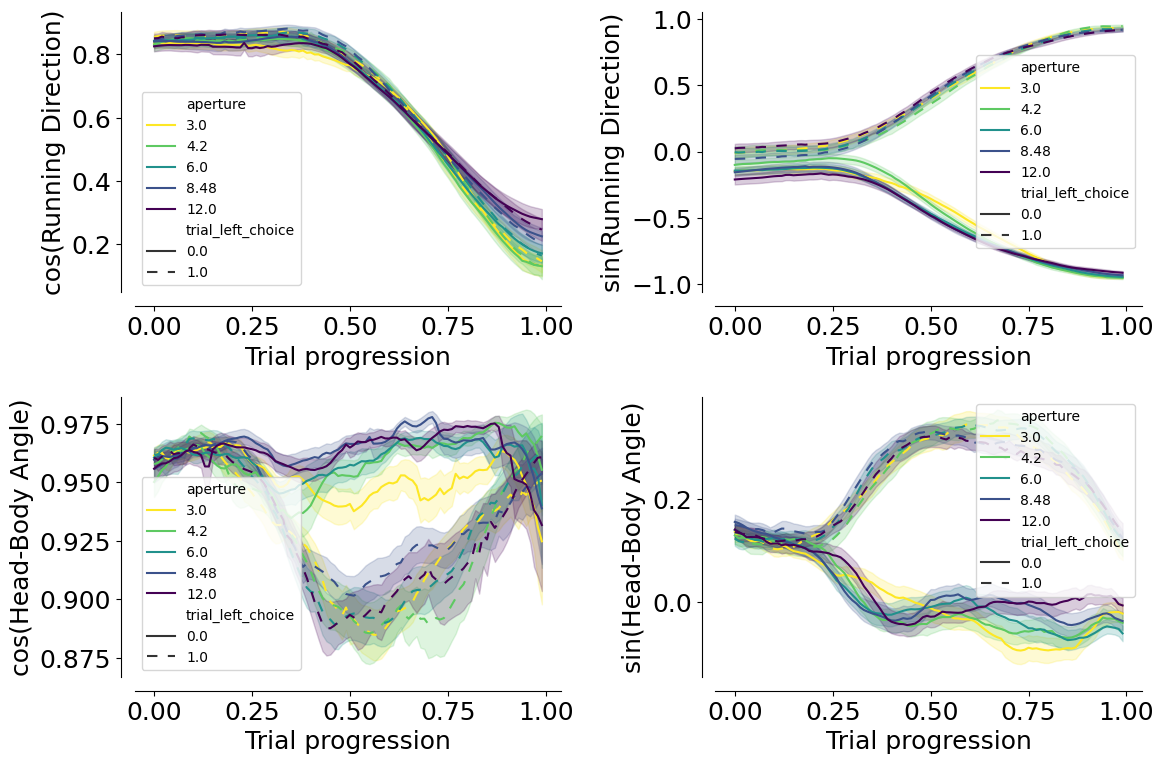
- Benquet, C., Sainsbury, T., Bruneau, L., Lin, Y., Cai, C., Popova, M., Ponder, K., Ntanavara, L., Froebe, R., Tan, Z., Fahey, P., Franke, K., Franco, L. M., Jones, K., Chen, Y., Keller, R., Pitkow, X., Niell, C. M., Tolias, A. S., & Mathis, M. W. (2026). Visual uncertainty and task demands shape active sensing strategies in mice. Current Biology, 36(14), 3523-3534.e9. 10.1016/j.cub.2026.06.011